After a recent spate of births and pregnancy announcements on my facebook feed, it seemed Australians were finally heeding the words “one for mum, one for dad, and one for the country” (Costello dixit).

What is surprising is how far behind the national average my friends are. Only 29% of my female friends aged 30-342 have reproduced. This is less than half the national average for the same cohort (62%)3 . By my age, 47% of Australian women have had at least 2 kids!
Whilst my facebook friends in their late 30s (35-39) do some catching up, they still fall way behind their national quota (63% vs. 79%).
If I thought my world was being overran by babies, I can’t imagine what the average early-30s-Australian’s facebook page looks like!
I always thought my friends were special, and at least on this topic it seems to be the case, but I suspect the effect is mostly one of delayed production, rather than a total boycott. This will probably be exacerbated by the rapid growth in the fertility of over 35s.
 While the rate falls away after 40, with less than 1% of women in Australia giving birth past 42 in 2010, the fertility rate of 35 year olds has doubled since 1989. Moreover, the rate for 40-year-olds has more than tripled in the same period.
I probably shouldn't be surprised when infants completely take over my feed in the coming years.
_________________________
The following three graphs are included in response to questions in the comments section. They are added for completeness.


______________________________
1: Births, Australia, 2010 - http://www.abs.gov.au/ausstats/abs@.nsf/mf/3301.0
2: Friends grouped in 5-year brackets (mostly for confidentiality reasons… and lack of exact age information)
3: Australian Census of Population and Housing, 2011.
This should not surprise me as the majority of my friends are in their birth-giving prime (perhaps not biologically, but at least numerically). In fact, their age distribution closely mirrors Australia’s fertility rate curve1.
I always thought my friends were special, and at least on this topic it seems to be the case, but I suspect the effect is mostly one of delayed production, rather than a total boycott. This will probably be exacerbated by the rapid growth in the fertility of over 35s.

I probably shouldn't be surprised when infants completely take over my feed in the coming years.
_________________________
The following three graphs are included in response to questions in the comments section. They are added for completeness.


______________________________
1: Births, Australia, 2010 - http://www.abs.gov.au/ausstats/abs@.nsf/mf/3301.0
2: Friends grouped in 5-year brackets (mostly for confidentiality reasons… and lack of exact age information)
3: Australian Census of Population and Housing, 2011.
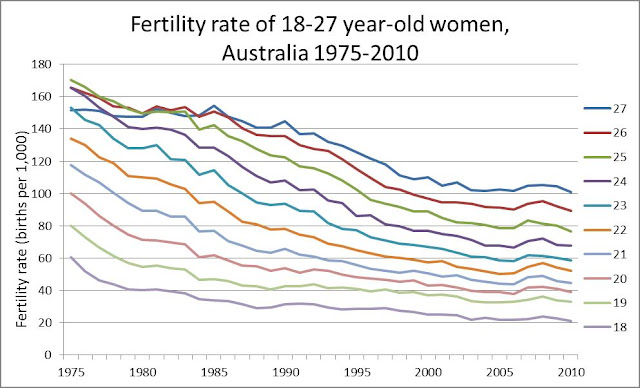
1. What does fertility rate look like under 35? (2nd graph)
ReplyDelete2. Whats the cause of the bump in the 55+ category (1st graph)
Personally, my suspicion for 2. is the fall off in the use of effective contraception in over 50-year-olds: unfortunately a large number of people think they are too old to have kids but even when perimenopausal it is possible to fall pregnant!
ReplyDeleteIn the first graph, the bump in 55+ category is not in fertility - it is in the % facebook friends in that age bracket... the bump would be because it is 55+ so includes everyone from 55 to 100 y/o.
ReplyDeleteAnonymous "the third" is spot on about #2. The bump is not in fertility, but rather the percentage of my friends who is 55+.
ReplyDeleteAs for #1, there are three different patterns:
From 18 to 27, there has been steady decreases in fertility rates.
28 to 30 are steady
31 to 34 are increasing, but not at the same rates as the 35 to 40.
I'll add these last three graphs to the post above.
Thanks for the questions!